Manage Datasources
The primary stateful data store for litmus's chaos center is a mongoDB statefulset. It powers all the features in chaos center including authentication, chaos injection and analysis, agent connections etc. Apart from the primary data store, the portal provides a way to add Prometheus (TSDB) data sources for time series data visualization and monitoring. The principle of Open observability drives the chaos center and allows users to manage the data sources for a project in multiple topologies for agent specific and cross agent dashboards. The system allows to either have multiple data sources or a single data source scraping metrics and events from all target agents for monitoring chaos impact on application OR infrastructure.
Prerequisites#
The following should be required before knowing about managing data sources in chaos center:
Data flow architecture#
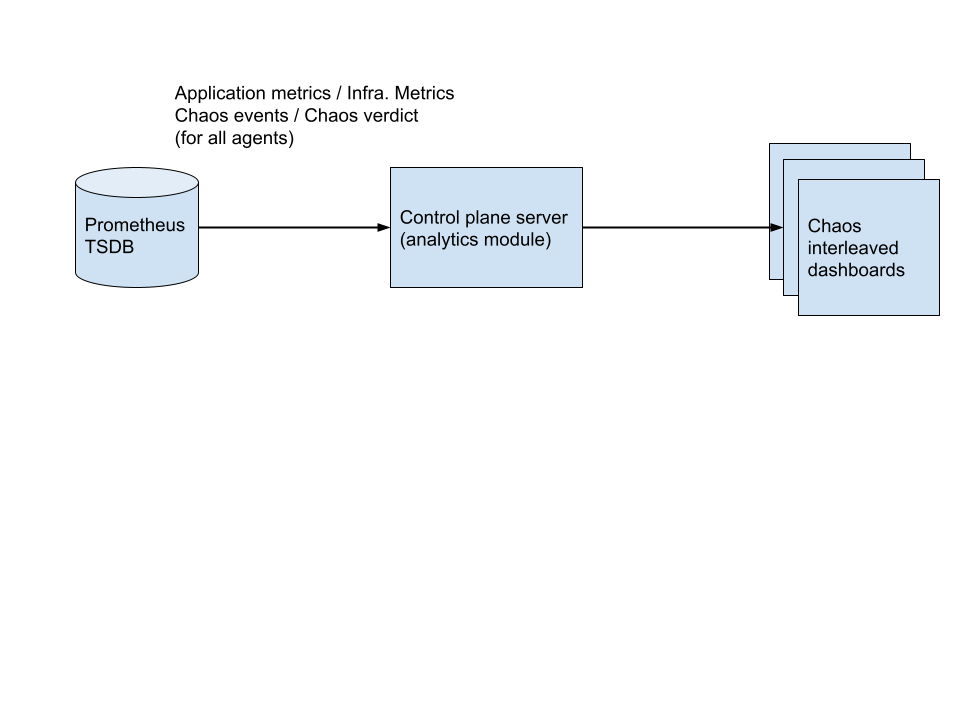
The chaos center provides the functionality to connect multiple prometheus data sources across projects to harness insights on application or system behavior during chaos manifested on real-time monitoring dashboards. Litmus follows an open observability model which enables users to plug metrics from any Prometheus exporter into the data source connected to a chaos center project to visualize the same on dashboards. Along with system and application metrics the metrics exposed by chaos-exporter service (a prometheus metrics exporter for chaos injection events and results or verdicts) on the execution plane or target agent's cluster is necessary to be ingested into the same data source to be connected to the project in order to facilitate chaos interleaving. Existing monitoring infrastructure for observing the target agent's cluster can also be used if it is prometheus based, plugging the metrics from chaos-exporter in such cases should be sufficient.
 Data flow from data sources
Health check for Time-series database#
The query timeout is used for all the queries associated with all the dashboards connected to the given data source, including querying data while editing the dashboard queries, although the default request timeout for the health check of the data source while connecting, updating or listing it is 5 seconds.
Scrape interval#
The scrape interval is used to control the lower limit of minStep for queries multiplying by denominator of query resolution for a dashboard consuming the data source; the same might be used for limiting the refresh rate for dashboard views with relative time range in later versions of the Litmus center.
Supported versions#
The Litmus center supports Prometheus 2.1 or later.
Summary#
LitmusChaos facilitates in-house real-time monitoring for events and verdicts metrics exposed by the native chaos-exporter for each target agent. These events and metrics can be scraped from a Prometheus TSDB connected to chaos center to overlay on top of application performance and infrastructure monitoring graphs. Some considerations for health-check, metrics scraping interval and version support have been stated.