Monitoring
Monitoring is a key part to effectively watch and understand the state of the systems. In Litmus, the monitoring is split into a two-fold approach:
- Metrics Monitoring
- Events Monitoring
Metrics Monitoring#
Metrics Monitoring enables the users to monitor the chaos metrics generated during chaos injection, which is exported by the chaos exporter to be consumed as time-series information.
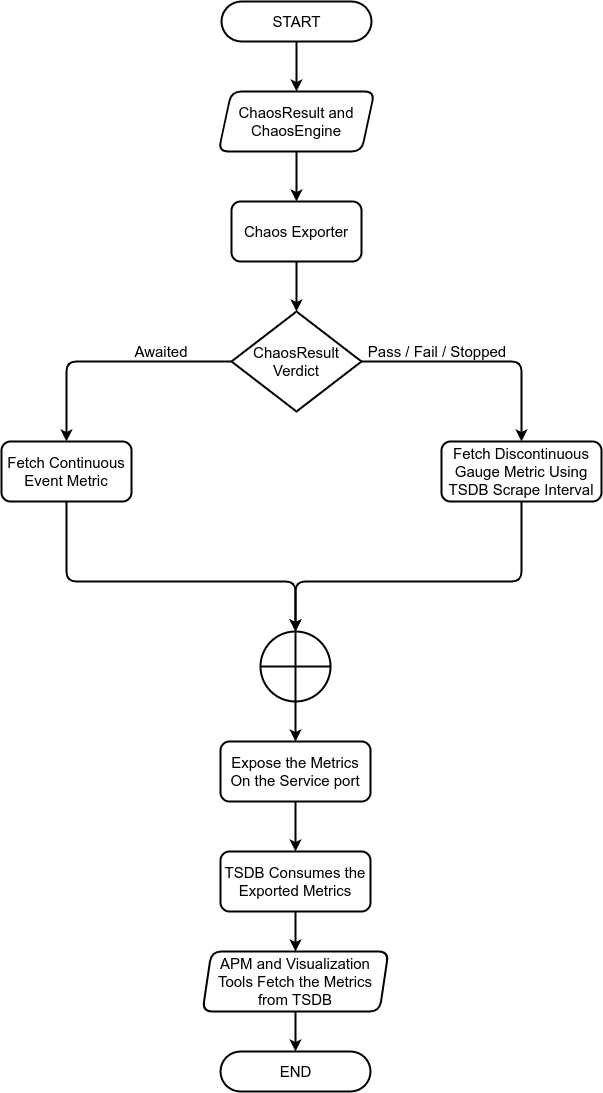
Observability Flow for Metrics Monitoring#
- During the event of chaos, the ChaosResult CR and the ChaosEngine CR are fetched by the Chaos Exporter.
- If ChaosResult verdict is "Awaited", then the Continuous Event Metrics are fetched by Chaos Exporter. Else, if the verdict is "Pass" or "Fail" or "Stopped", then the Gauge Metrics are fetched by Chaos Exporter at a fixed TSDB Scrape Interval.
- The fetched metrics are then exposed at the Chaos Exporter Kubernetes service.
- TSDBs consume these metrics and store them as time-series value.
- APMs and Visualisation Tools query and fetch the chaos metric from the TSDBs.
Events Monitoring#
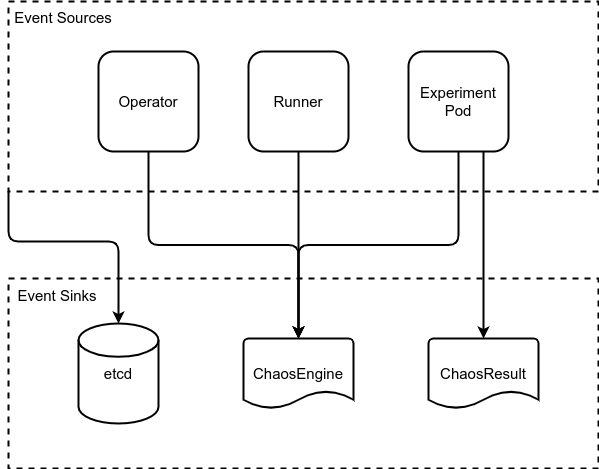
Events Monitoring enables the users to monitor the Kubernetes events that are created as part of the orchestration of chaos injection by Litmus. These events occur through different points in the lifetime of a Chaos Experiment's execution to accomplish.
- Like any other Kubernetes Events, these events also get stored inside the etcd.
- The ChaosEngine CR events are initiated by the Operator or the Chaos Runner or the Chaos Experiment itself.
- The ChaosResult CR events are initiated by the Chaos Experiment itself.