Visualize the Workflow Execution
Visualization is an important aspect while doing chaos engineering. It allows the user to discover and inspect different changes that occur during a Chaos Workflow execution.
With ChaosCenter, the real-time data and status of the workflows can be observed. Valuable information like pod logs, workflow status, chaos results can also be viewed.
Prerequisites#
The following should be required before creating a Chaos Workflow:
- ChaosCenter
- Workflows
Litmus Workflow#
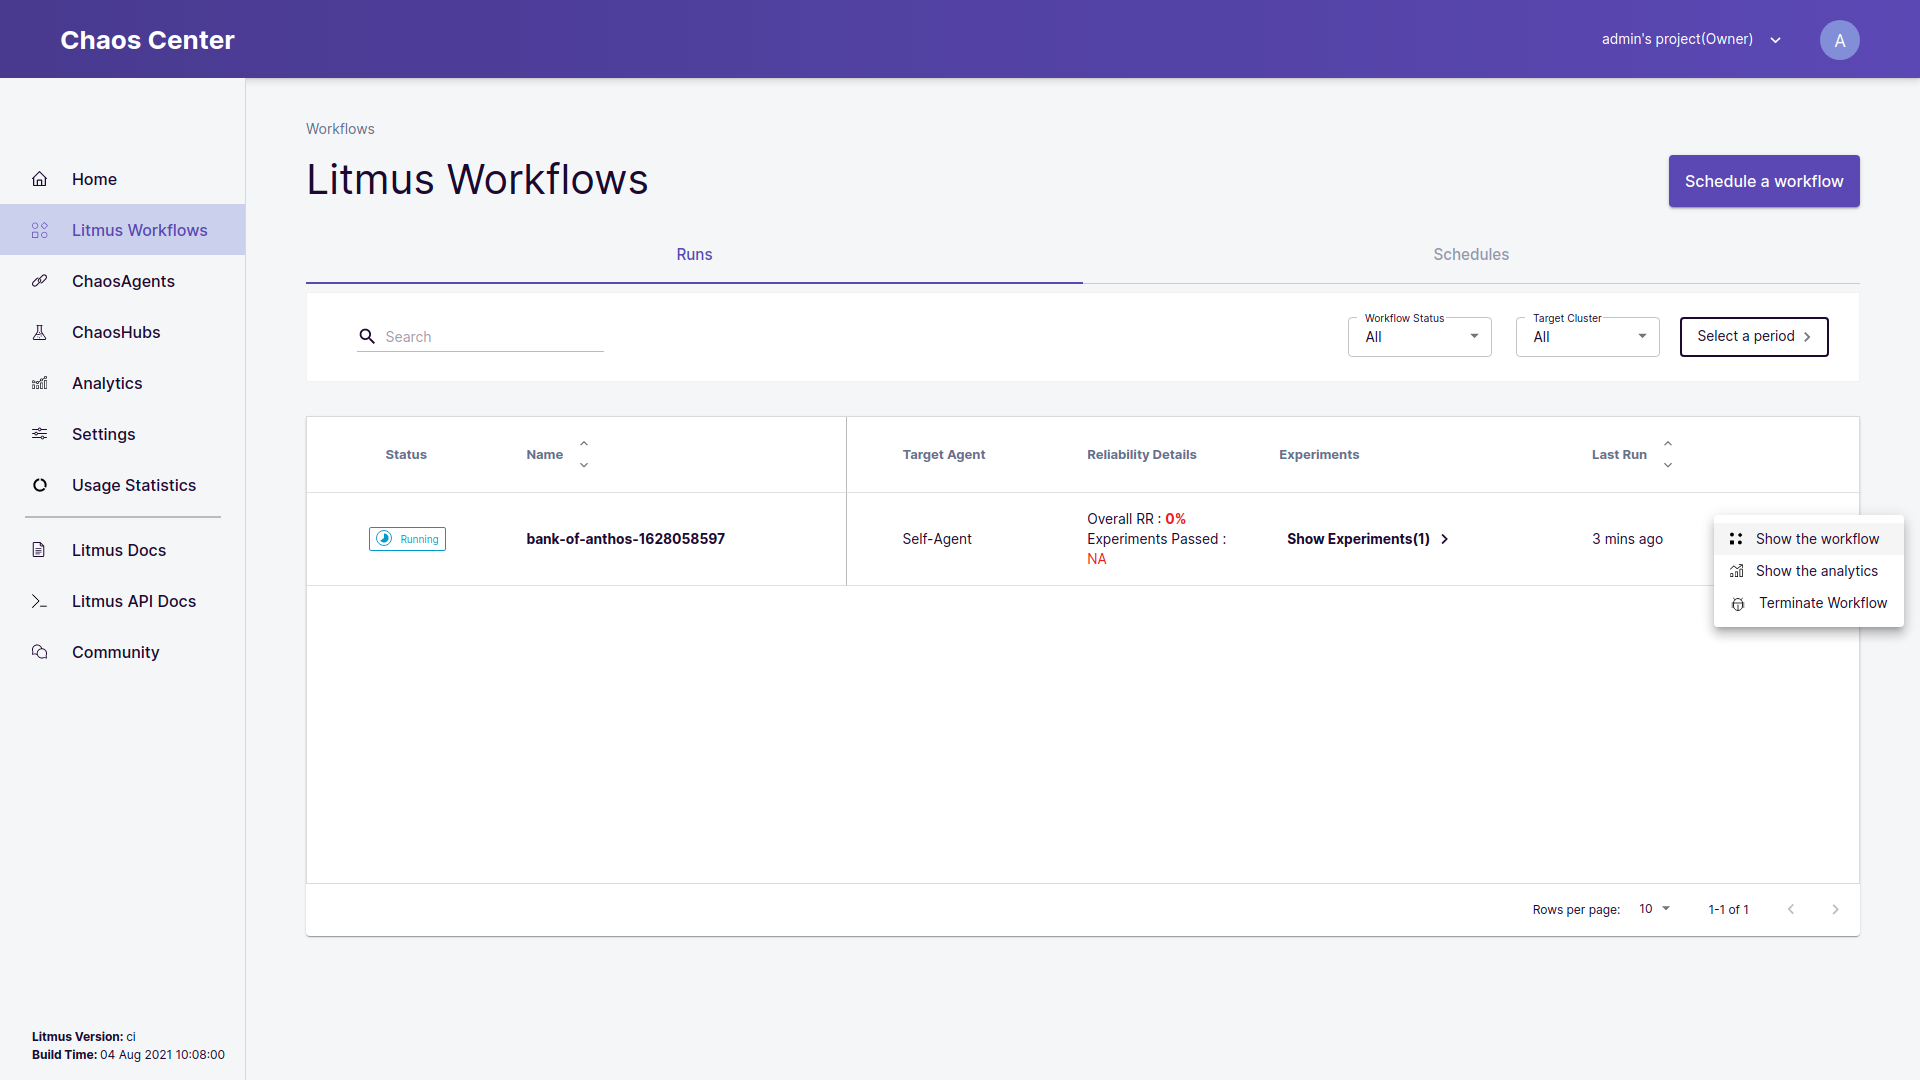
After scheduling a workflow, you are redirected to the Litmus Workflow page which is divided into 2 sections Runs and Schedules.
Runs#
This section consists the list of individual workflow
runs and its related data like Workflow Name, Status, Reliability Score etc.
This table displays the real-time status of the workflows.
Schedules#
This section consists the list of workflow schedules. These schedules can consist one time workflow runs or CronWorkflows. User can perfom serveral operations in this table, few of them are listed below:
- Disable a CronWorkflow
- Download the workflow manifest
- Save the workflows as a template
- Edit a schedule
- Re-run a workflow etc
Visualize a Litmus Workflow#
To observe a workflow, user can either click on the workflow name or click on the three dots and select Show the workflow option in the runs table.
The Workflow Details page is divided into 2 sections:
- Graph View: In this section a realtime graph of the workflow is displayed. This graph contains valuable information regarding the status of individual steps of the workflow.
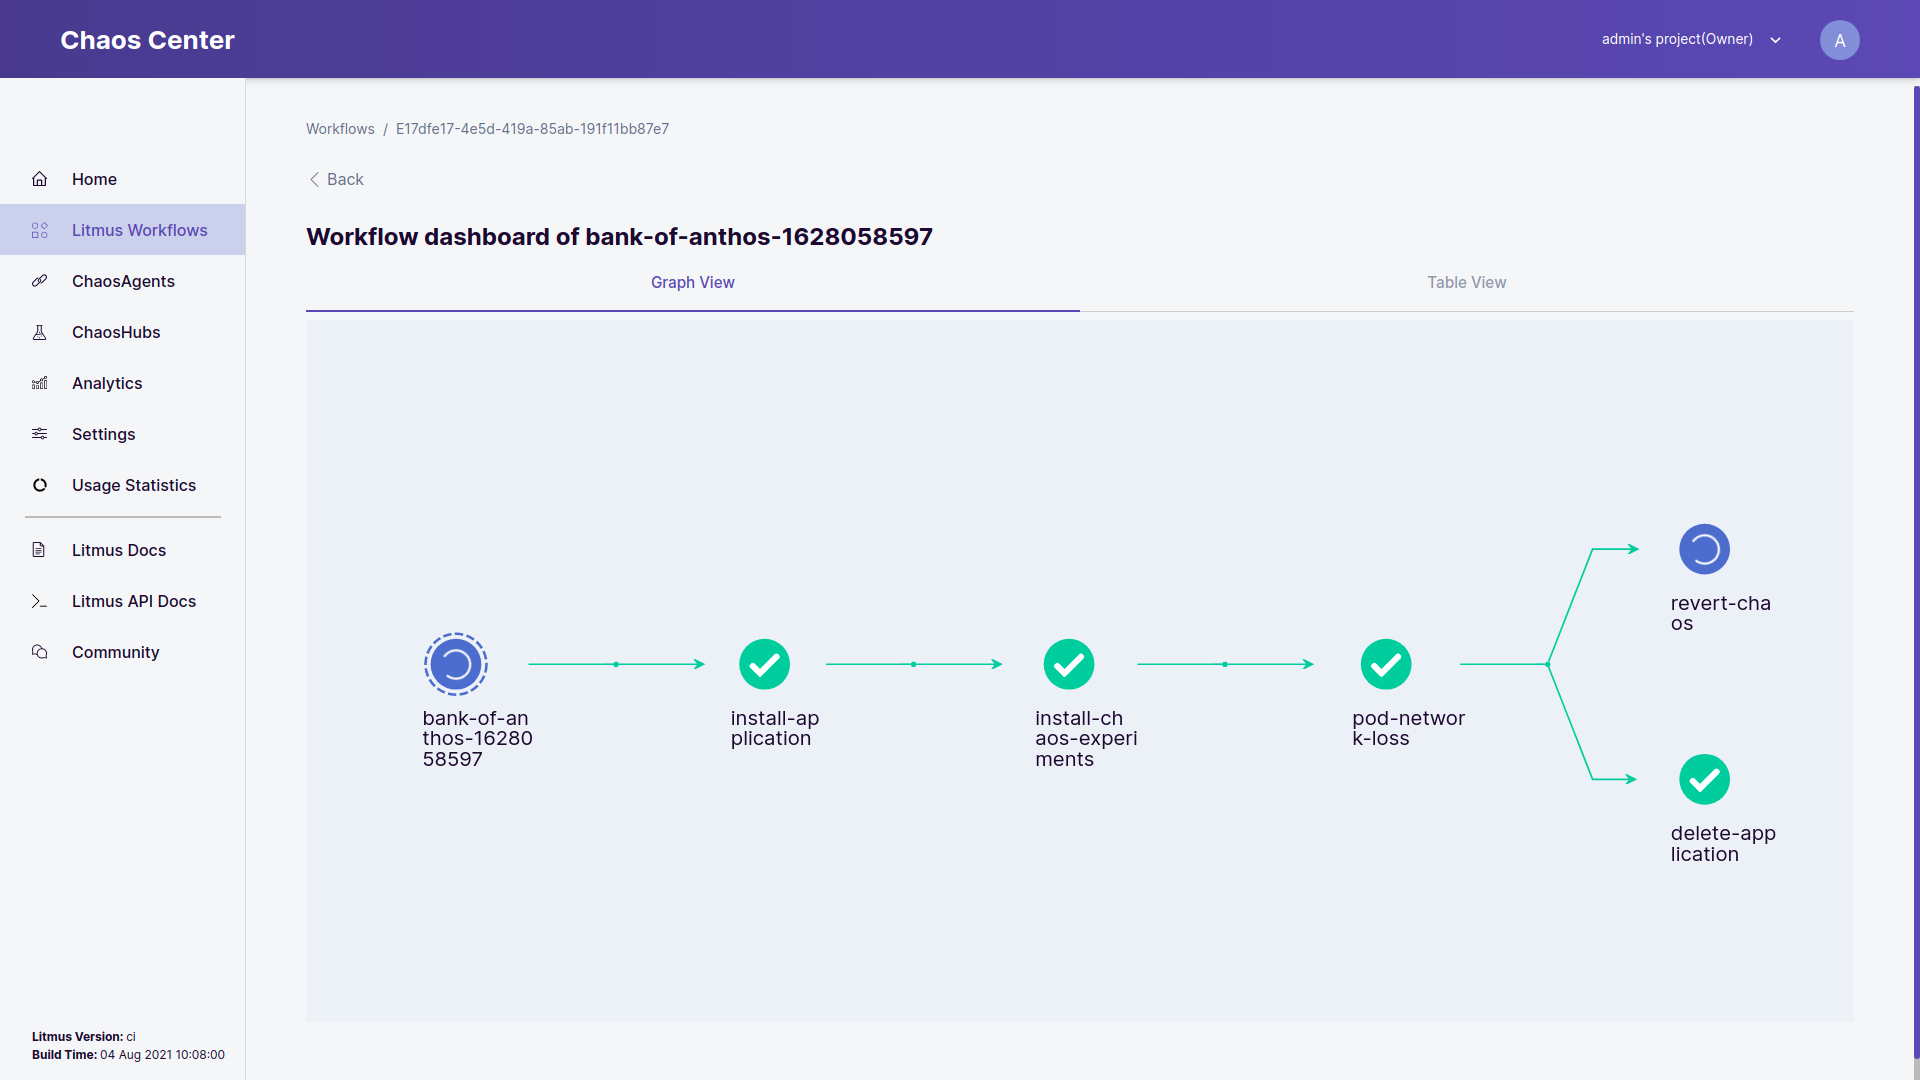
To view the details of the step, you can click on the individual nodes. This will open a field which displays the node details and the logs related to it.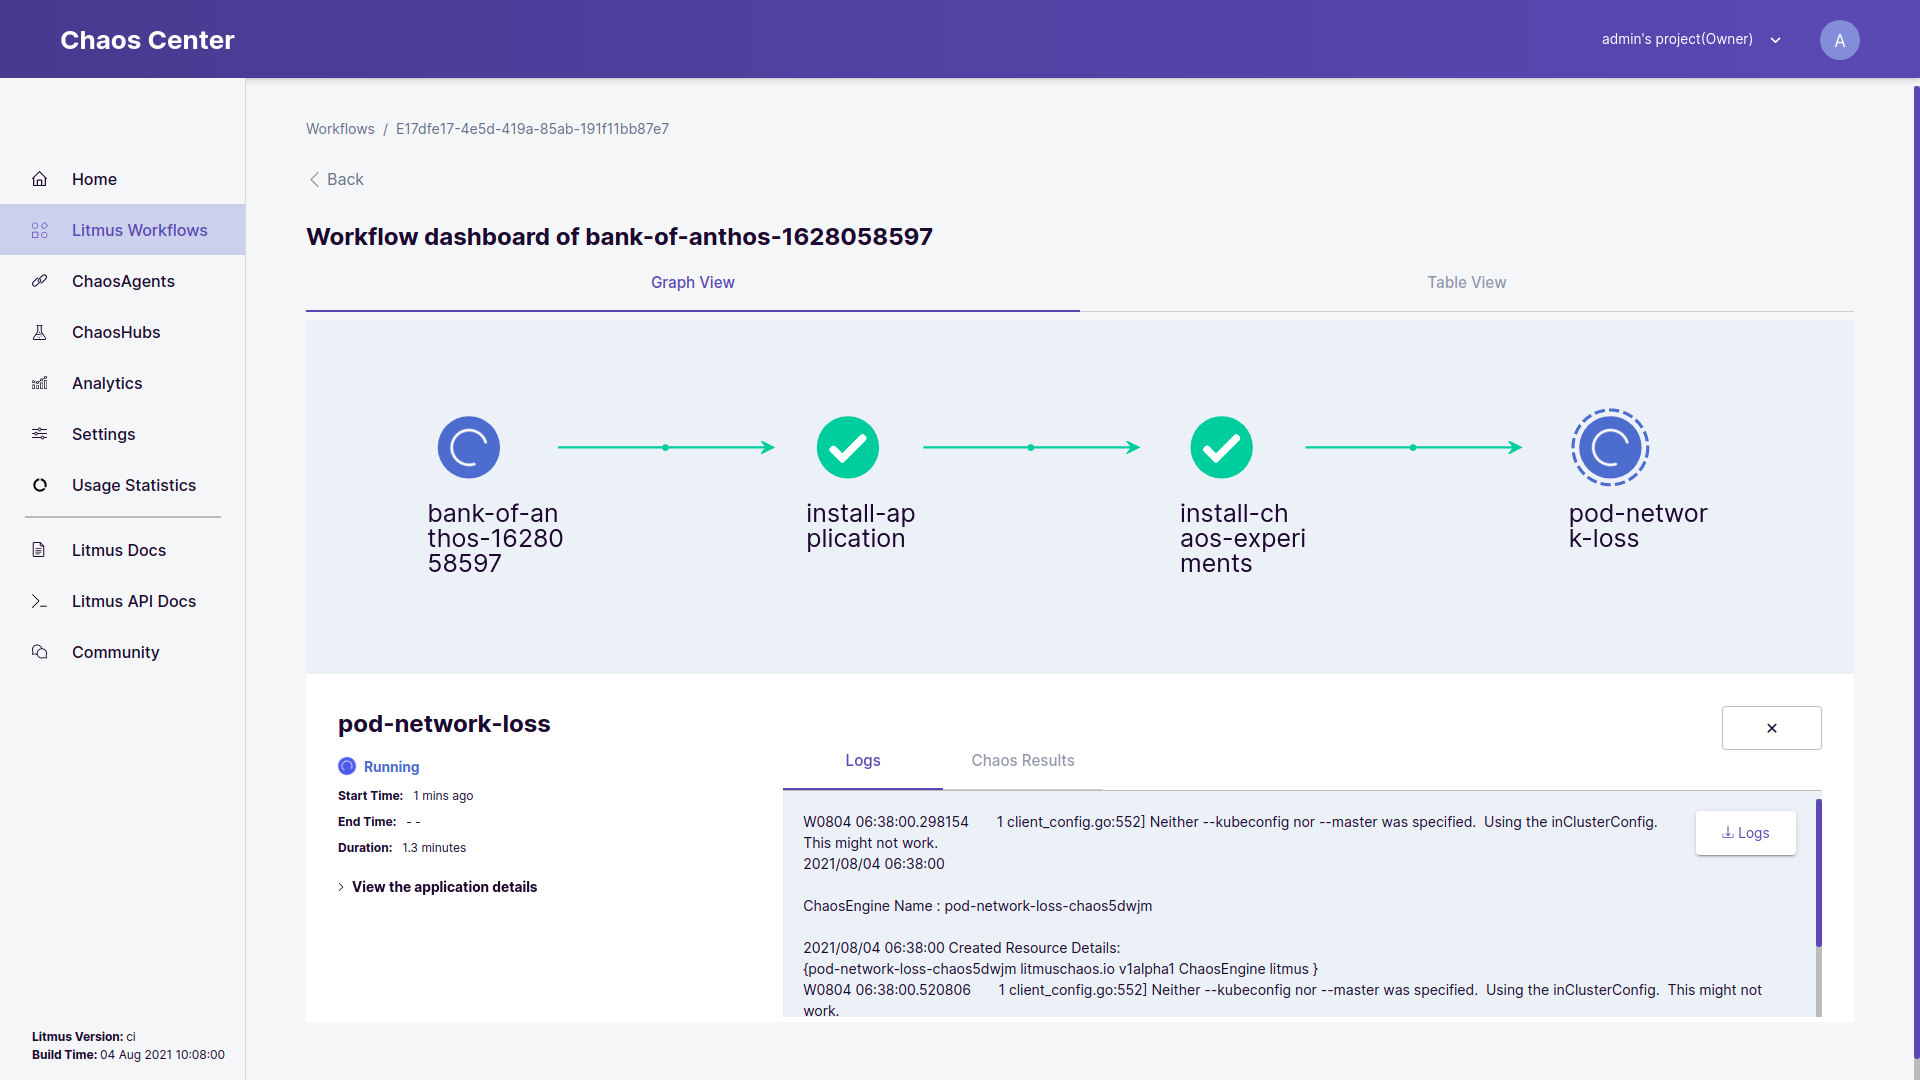
note
If the selected node is an experiment pod which consists of ChaosEngine CRD, a button to Download the logs will be available. Similarly, a tab named Chaos Results will also be available, which displays the ChaosResult of the experiment once the workflow execution is completed.
- Table View : Similar to the Graph View, this tab consists the table view of the workflow. The table consists of the different workflow steps along with their status.
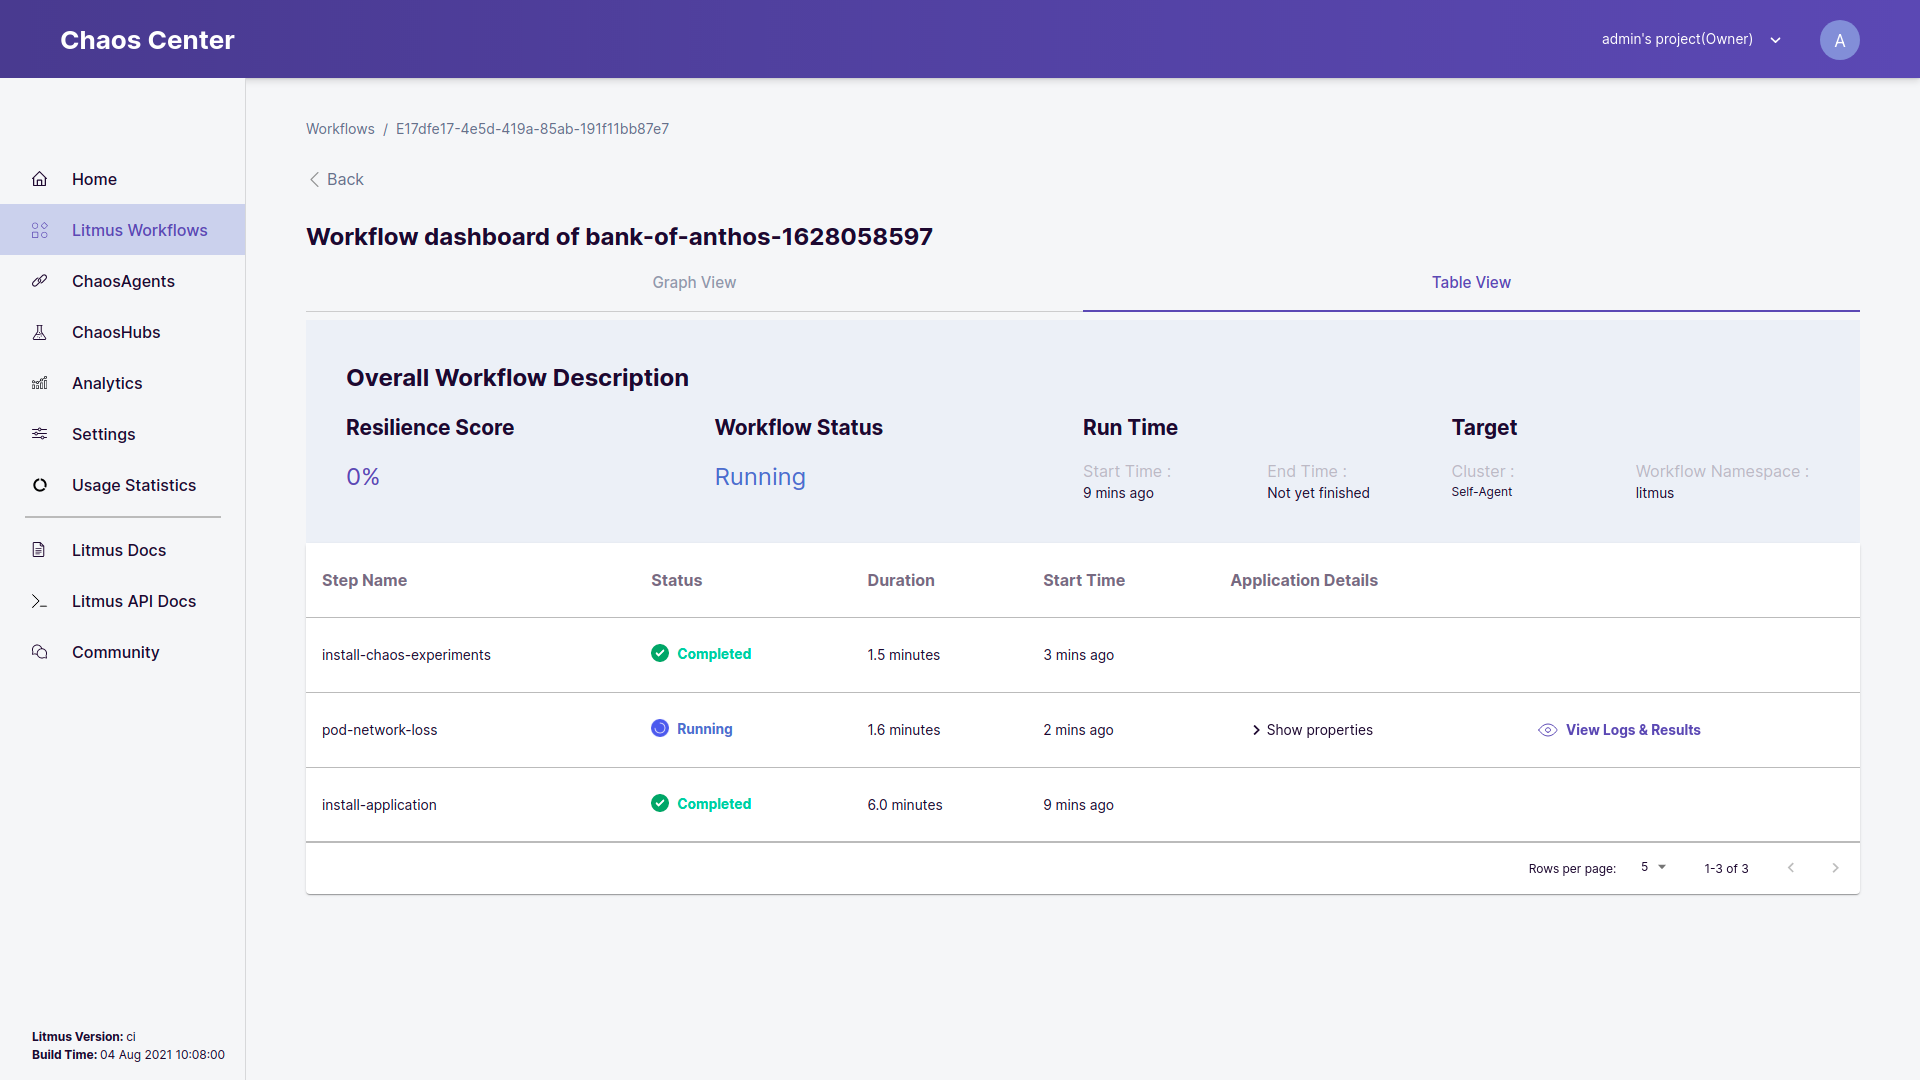
On clicking the View Logs & Results button in the table, a pop-over is displayed with the logs of the selected step.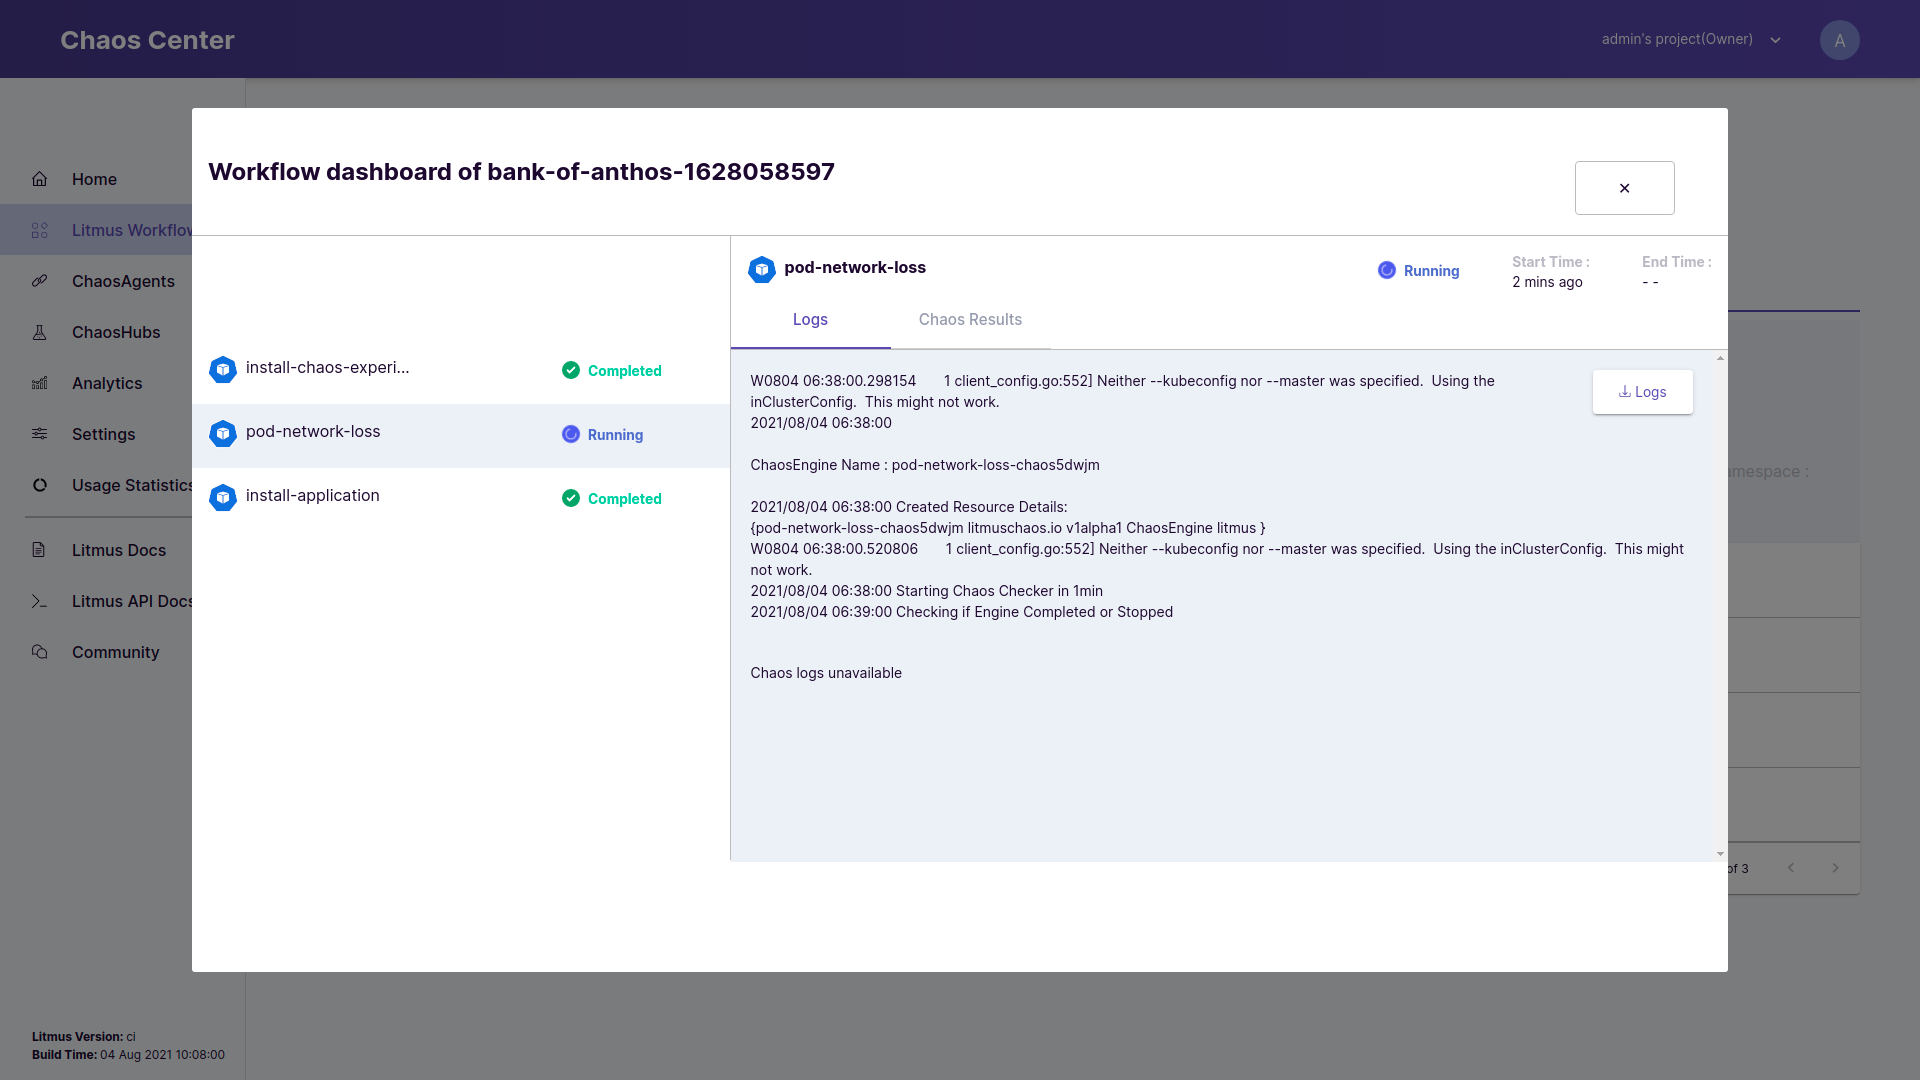
Summary#
After scheduling a workflow, a user can view the details of the running workflow from the ChaosCenter. ChaosCenter provides a realtime graph that is used to visualise the workflow and get the details of individual step of the workflow. Important details like the logs and target applications can be viewed from ChaosCenter. These logs are also downloadable. User can view the details in 2 different ways i.e Graph View and Table View. Once the workflow exection is completed, the resiliency score is calcualted and the ChaosResult for the ChaosEngine pods are available now.