Monitor Chaos in your Application/Infrastructure
Application OR Infra dashboards provide a way to monitor the chaos impact on application resources, services or cloud infrastructure from within the ChaosCenter. They are user-defined and offer a way to observe systems on ChaosAgent’s cluster in the specified scope (Cluster or Namespace)
These dashboards are associated with ChaosAgent(s) and consume a specific Prometheus data source connected to a project in ChaosCenter to display chaos events, verdicts and metrics for cloud resources.
Prerequisites#
The following should be required before knowing about application or infrastructure monitoring using chaos center:
Data flow architecture#
The chaos center automatically gives the functionality to create dashboards for agents registered under a project and provides chaos interleaved monitoring of services and targets for both applications and underlying infrastructure. Litmus follows an open observability model which enables users to plug metrics from any Prometheus exporter into the data source connected to a chaos center project to visualize the same on dashboards. Some of the standard metrics include kube-state-metrics and node-exporter-metrics to monitor Kubernetes and infrastructure. Similarly many applications expose metrics that can be scraped via Prometheus or have standard exporters to expose the same. The prometheus-black-box-exporter can also be used to collect basic application metrics running on Kubernetes.
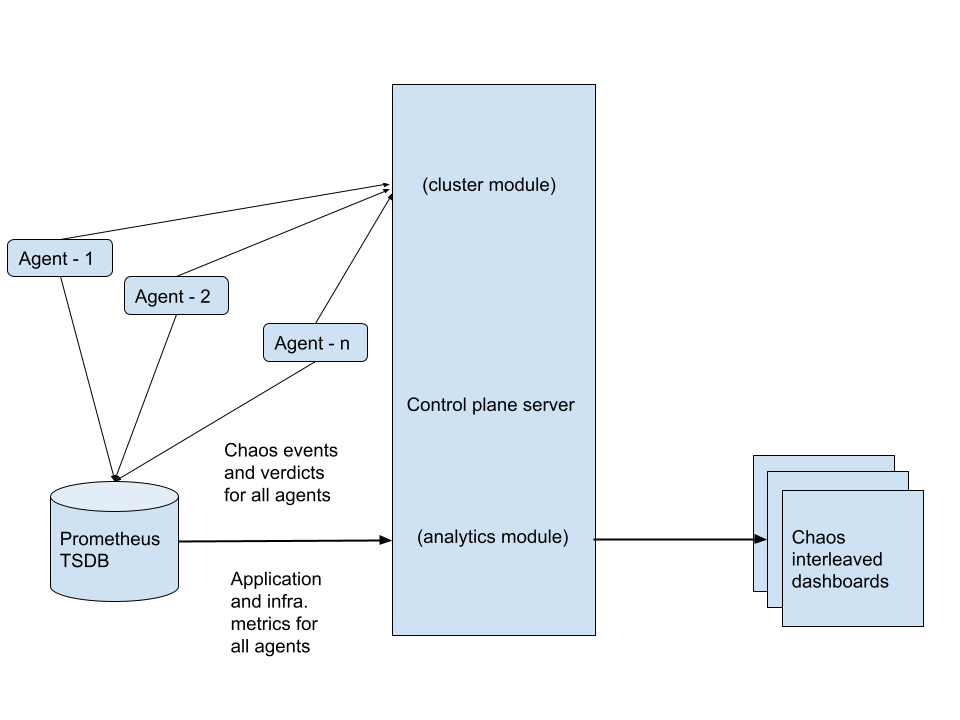 Data flow for application and infrastructure monitoring
Interleaving chaos events and metrics#
Litmus Chaos agent comprises several components, one of them being the chaos-exporter It is a Prometheus exporter for event and gauge metrics generated as chaos engine events and chaos experiment verdict during fault injection using the Litmus chaos operator. Two important prometheus metrics being litmuschaos_awaited_experiments and litmuschaos_experiment_verdict These two metrics are consumed for each agent monitoring dashboard in a Chaos center project. They are pulled from the data source and then transformed to generate a single metric patched with details from both. The final metric is visualized as an enclosed area on every graph panel on a monitoring dashboard in view.
Whenever a fault is injected the starting point of the enclosed area marks the time of first chaos injection after the pre-chaos check completes. Sequential injections from a single chaos engine are combined together to form a single event enclosure to give the viewer a cleaner projection of the chaos interval overlaid on top of the metrics from application resource, service or underlying infrastructure being monitored. The end marker represents the end of the chaos injection phase. The user can hover on the enclosed area after expanding the graph view to make use of the integrated Chaos metric info table on the graph panel where metadata of the AUT, chaos experiment, engine, workflow and results like probe success percentage and verdict are logged which are updated with each iteration of chaos injection based on a defined chaos engine. Hovering over different enclosures allows users to browse chaos injections independently.
The identity of each chaos injection for Chaos center is the chaosresult_name parsed from the labels of both the event metric and the verdict metric as a consistent legend name. This forms the basis of updates on the chaos injection and patching of verdict to a chaos event enclosure. Litmus center uses an algorithm to update all the chaos metric table information based on the field name and the timestamp of chaos injection associated with it for each event based on its corresponding verdict.
Both chaos event query and chaos verdict queries can be updated from the Chaos center UI based on metric collection methods and Prometheus data source configuration, provided the legend chaosresult_name is always available as a label to both the metrics, to be used by the ETL pipeline for ensuring that the chaos interleaving algorithm works impeccably for all fault injections on the agent cluster.
Default chaos event query
litmuschaos_awaited_experiments{job="chaos-exporter", chaos_injection_time!="", instance="chaos-exporter-service"}Default chaos verdict query
litmuschaos_experiment_verdict{job="chaos-exporter", chaosresult_verdict!="Awaited", instance="chaos-exporter-service"}The central chaos table on the dashboard level above the graph panels shows an aggregate view of all the faults injected during the time interval set while browsing the dashboard. The fields of the table being, Chaos result name, Workflow, Engine context and Verdict. The Verdict shows only the verdict of the latest fault injection associated with a Chaos result name. In order to browse all the verdicts associated and more data fields of the particular fault injection, the user can hover over the enclosure on any expanded graph panel and view it on the integrated Chaos metric info table.
Schema for monitoring dashboards#
The monitoring dashboards in chaos center follow a definite structure as a JSON. The diagram below shows a pictorial representation of the same.
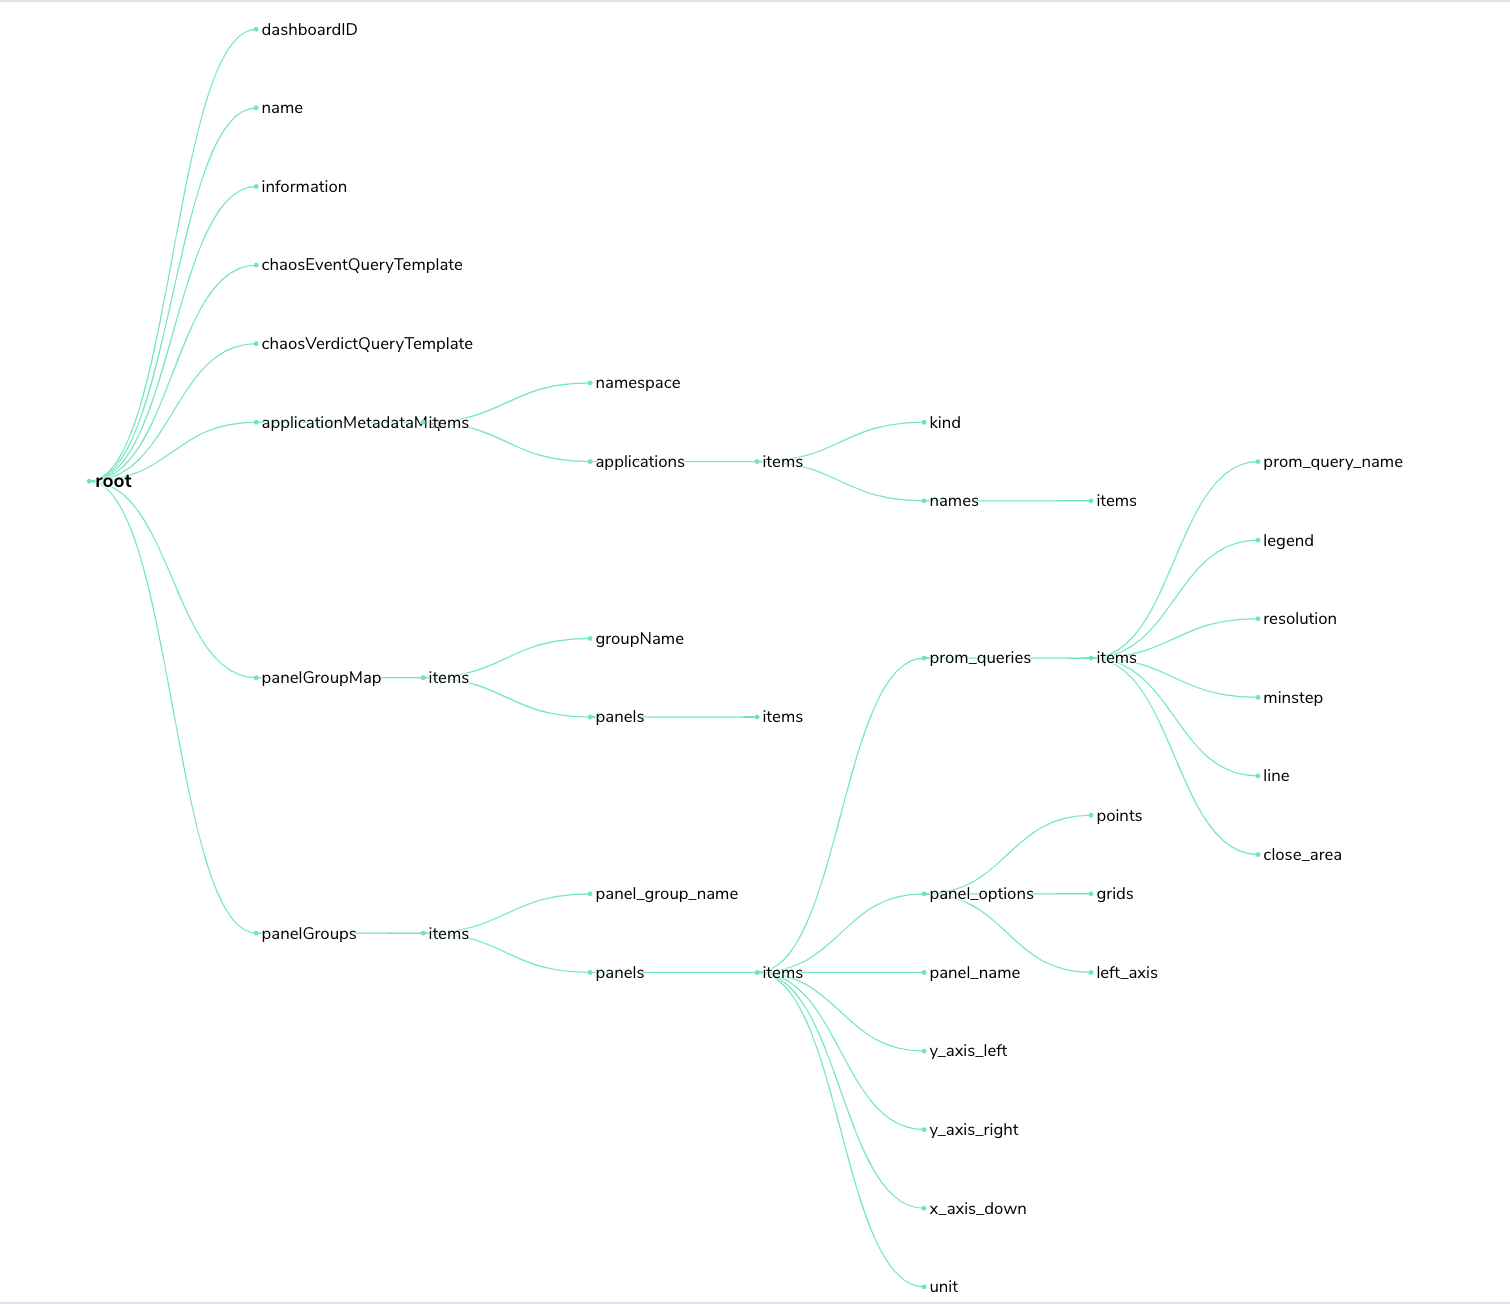 JSON schema for monitoring dashboards
Summary#
Building a hypothesis around steady-state behaviour, varying real-world events, running experiments in production, automating them to run as a workflow in CI pipelines, and minimizing the blast radius are some advanced chaos practices. These are all backed by extensive monitoring infrastructure managed by SREs heading IT operations. Monitoring chaos and performance metrics is an observability paradigm providing real-time insights into the four golden signals for monitoring distributed systems namely, latency, traffic, errors, and saturation. LitmusChaos facilitates real-time monitoring for events and verdicts using a native chaos-exporter. These events and metrics can be exported into any TSDBs (Time-series databases) to overlay on top of application performance graphs and also as additional visualizations for chaos testing statistics. Litmus also provides in-house monitoring support with interleaved dashboards on chaos center which can be shared across teams.