Analyzing a Workflow
Workflow Analytics allows you to analyze their workflows (Recurring/ Nonrecurring) & helps them to keep track of the workflow runs of scheduled workflows and their behaviour.
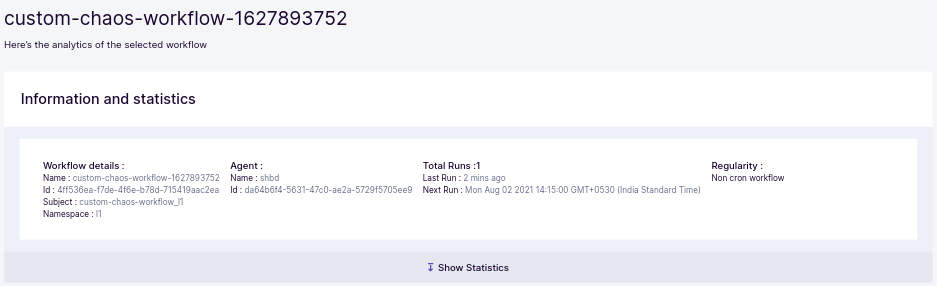
Workflow Details#
On the workflow analytics page, in the first container, you will be able to see the details about the selected workflow such as the workflow name, workflow id, agent details(name, namespace, etc.), and the workflow run details like the last run as well as regularity.
Workflow Statistics#
On clicking on show statistics, you will be able to see the experiment statistics, average resiliency score and pass/fail ratio for the workflows/experiments.
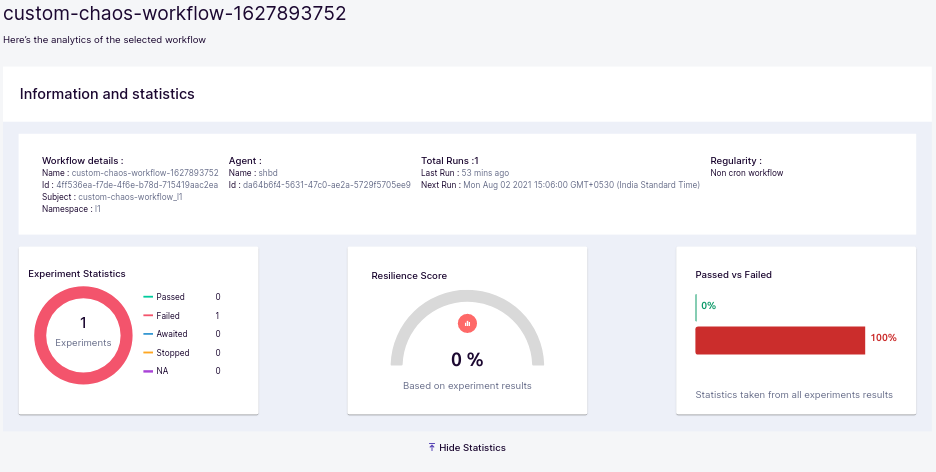
note
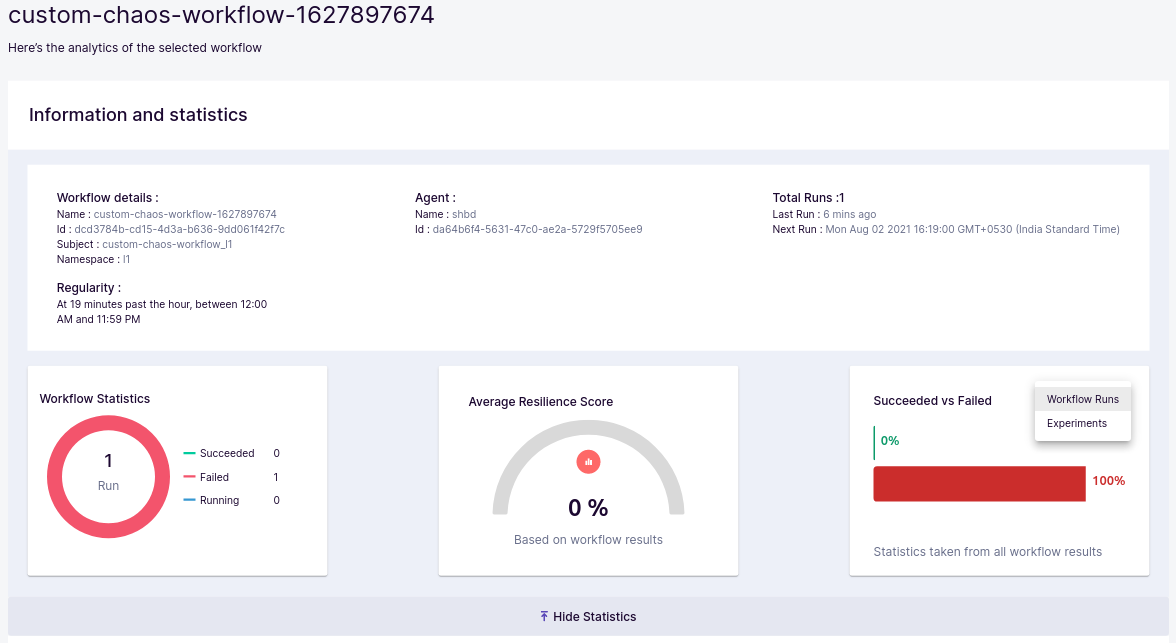
If the selected workflow is recurring or is re-run multiple times, then the average resiliency score for all the workflow runs is shown. A drop-down has been provided to switch between workflows & experiments for checking the pass/fail ratio.
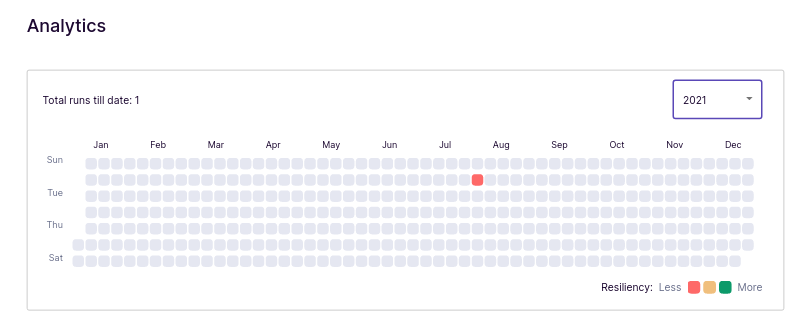
Workflow Heatmap#
If the selected workflow is recurring or is re-run multiple times, a heat map representing the days of the year showing all the workflow runs for the selected workflow can be observed. On hovering over a point in the heat map, the average resiliency score for that particular day will be shown in the form of a tool-tip.
Workflow Activity#
On clicking on a heat map entry, a stacked bar graph representing the pass/fail ratio is shown, on which you can see the workflow runs on that day and hover over the bars to see the resiliency for that particular workflow run on that day.
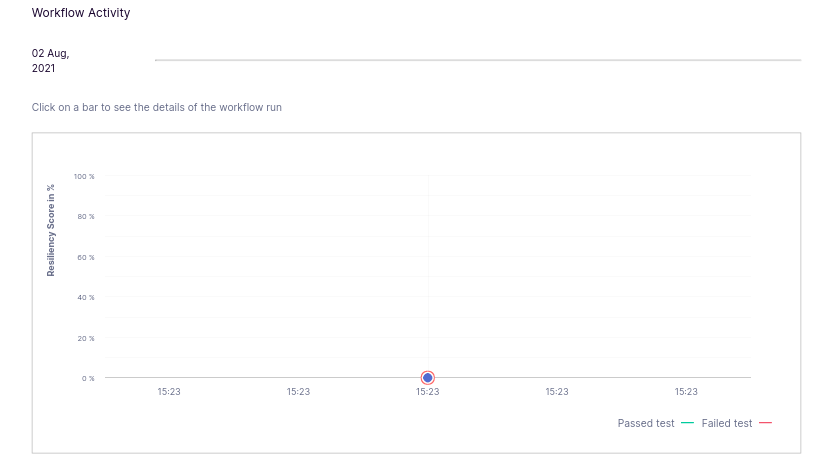
info
You can check Pass Count, Fail Count of Experiments & Resiliency Score by hovering over the bar for that workflow run.
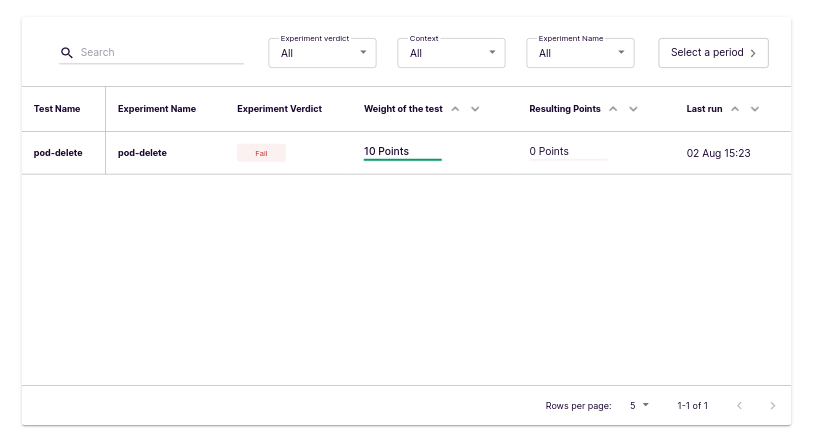
Experiments Table#
On clicking on a bar, more details about the workflow run represented by that stacked bar are presented in a tabular format. A table having individual experiments details is presented to the user, which helps them to get insights about the experiments.