Setup Observability with ChaosCenter
Overview Tab helps you to manage your connected data sources and dashboards, all while making it easier to view and analyze your workflows. The overview tab is split into 3 parts -
- Data Sources
- Application Dashboards
- Workflow Dashboards
Before you begin#
Before starting with observability setup, you have to connect an agent to get workflow statistics & keep track of workflows performance. For connecting a new agent, you can follow here .
Once the agent is connected, you will see a banner for adding data sources and a list of recently updated workflow dashboards (if any).
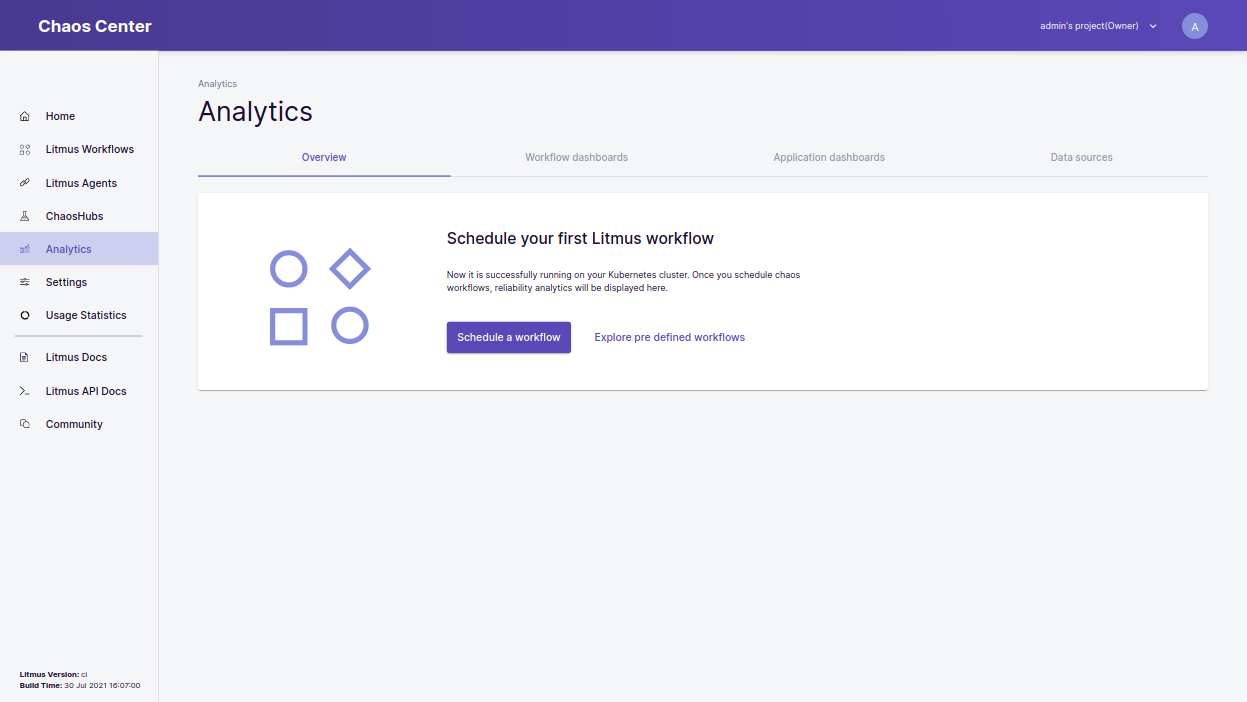 Overview page, When no workflows are running
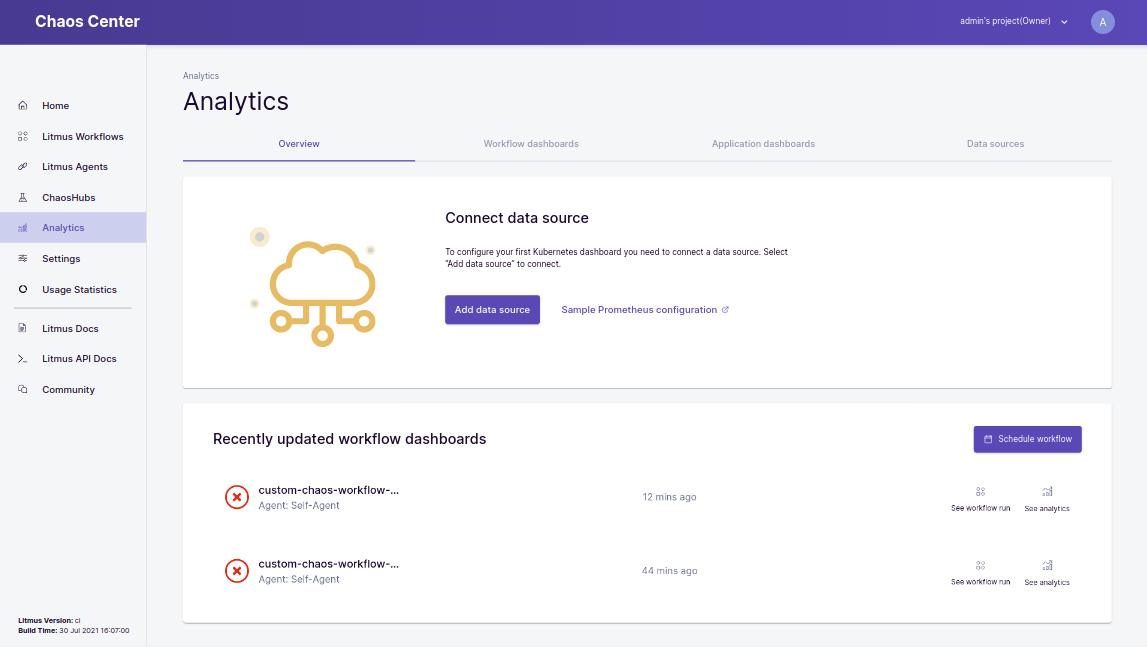 Overview page, When some workflows have been already scheduled
 If you already have a data source, then they can connect the same by clicking on Add data source button and following the corresponding instructions. For deploying a new data source, you can follow the sample configuration steps by clicking on Sample Prometheus configuration.
Once you have added a data source successfully, you will be able to see the data source listed on the overview page.you can add more data sources by clicking on Add data source button.
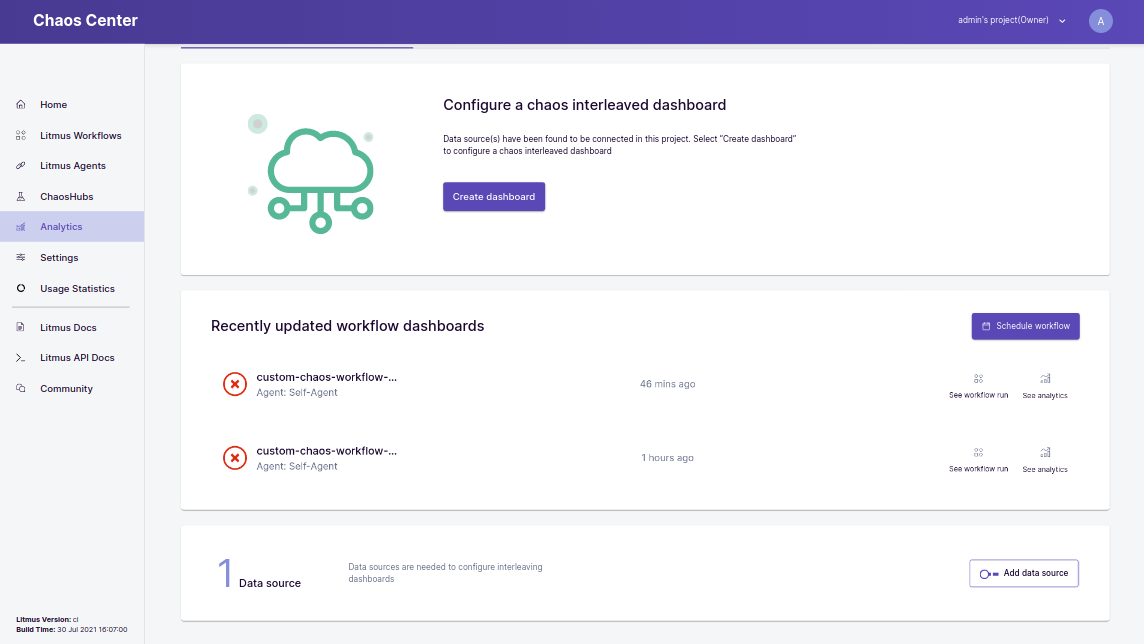
Now, you will get a banner with an option to add a dashboard for visualizing the data from the connected data sources.
After setting up the dashboard, you will be able to see the dashboard on the overview page.
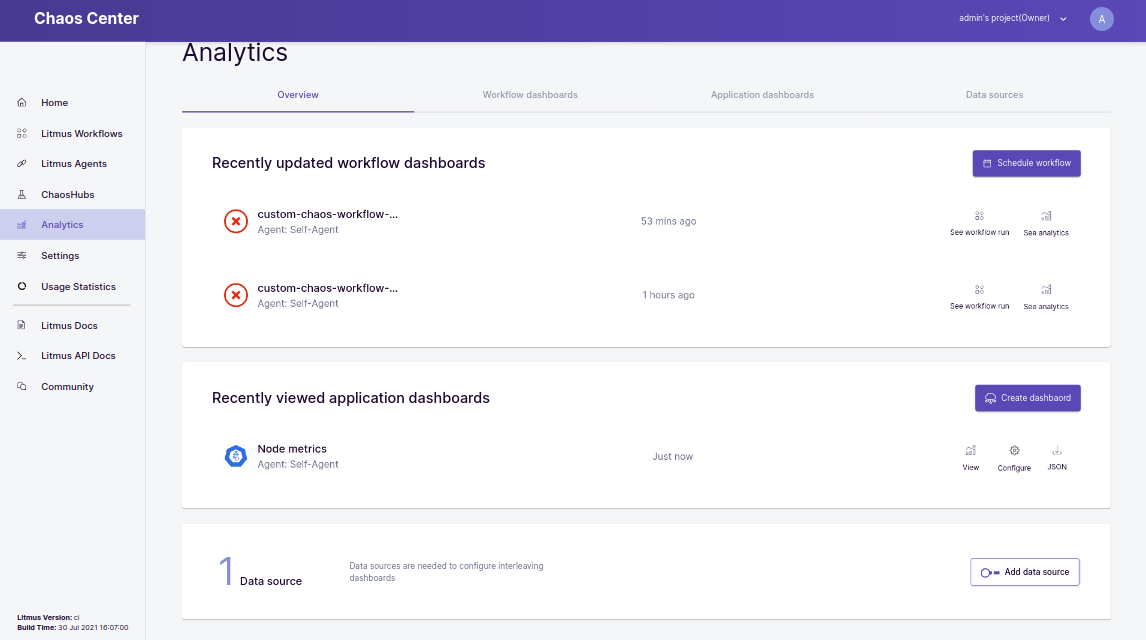
You can view, configure & download the dashboards in the form of JSON for reusability using provided buttons.
You can check the workflow analytics and the workflow run graph by clicking on see workflow run & see workflow analytics icons for a workflow from the list of workflow dashboards present on the overview page.